How to use Consul to use service discovery in Prometheus & Grafana

It is a tedious task to monitor an instance in Grafana, as you have to previously set up all the environment + add every new machine manually. Today we're gonna learn how to automate that stuff. It's very useful when working with a multi-cloud environment, a private cloud and auto-scaling instances as it's already an automated task. Some cloud providers offer Prometheus a service discovery, but when you have several clouds (or a private one) you have to make it real.
How to do it?
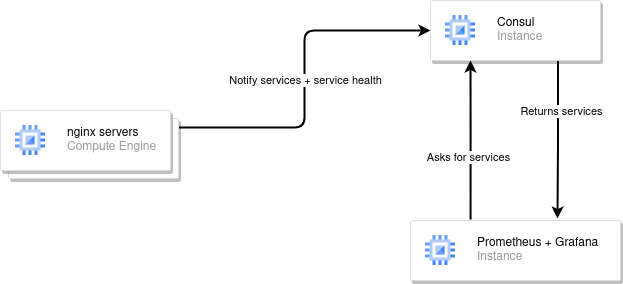
The response is Consul, consul is a service discovery service created by Hashicorp. we're gonna make Prometheus get our services from Consul and make it available from Prometheus and graph them in Grafana. As a service example, we're going to use node_exporter for system status and nginx-prometheus-exporter with nginx exposed as an auto-scaling example. This would result in the following diagram:
Requirements
We're going to work with Debian 11 via cli and the following network set-up:
- 10.1.0.1 :: Prometheus + Grafana server
- 10.1.0.2 :: Consul server
- 10.1.1.x :: nginx servers
For nginx we're going to create the template and then replicate it
For load balancing, we're going to implement it with HaProxy in a future post
Consul server
To install consul, we only need to follow the following steps, but we are going to need to dig further to get the results we're looking for:
# Update and install gnupg2 and curl for the following commands
apt-get update && apt-get install gnupg2 curl lsb-release

# Add consul's gpg key
curl -fsSL https://apt.releases.hashicorp.com/gpg | apt-key add -

# Add hashicorp's repository to our sources.list
echo "deb [arch=amd64] https://apt.releases.hashicorp.com $(lsb_release -cs) main" > /etc/apt/sources.list.d/hashicorp.list

# Update and install consul
apt-get update && apt-get install consul

# Check Consul installation version
consul -v
It's important to know that the consul binary we've just installed is not different from a client/agent version, ther're all the same, it depends on configuration and files used, so the previous script will also work for the rest of the post.
Now we are going to follow some steps to make it a secure and easy to understand set-up
consul keygen > /etc/consul.d/consul.keygen
We are saving the keygen into a separated file to back it up in case of losing consul configuration file
To configure consul, we are going to edit /etc/consul.d/consul.hcl and add the following configuration:
datacenter = "marcsg"
bootstrap_expect = 1
server = true
data_dir = "/opt/consul"
log_level = "INFO"
client_addr = "0.0.0.0"
bind_addr = "10.1.0.2"
node_name = "consul"
leave_on_terminate = true
rejoin_after_leave = true
connect{
        enabled = true
}
ui_config{
        enabled = true
}
encrypt = "3EY9MGe2a1ElUNrsl5E6rHAtJEL7lqe+1CDZAyY8yTU="
- datacenter will determine our datacenter name, must be the same as our client's.
- bootstrap_expect Number of consul servers expected.
- server settig it as true will run our consul service as a server and not as a client or - agent.
- data_dir consul's default data directory, it stores some persistant server values.
- log_level how we're going to treat logs when running consul's command.
- client_addr our clients addresses, if we want to secure it more, we can use - subnetting or only allow connections from determined ip's.
- bind_addr Our server ip address, not required if only using one single network card
- node_name our consul node name, if not defined it will use the machine - hostname.
- leave_on_terminate Leave cluster when terminating instance
- rejoin_after_leave Join cluster before leaving
- connect allow mesh connections.
- ui_config web based ui.
- encrypt Our consul key generated previously.
Now we do have a consul server, but it's not running as a service, to run it we need to run consul agent -config-dir=/etc/consul.d/ but it's not useful when running in a server, so we are going to create a new systemd service by creating /etc/systemd/system/consul.service file and adding the following content:
[Unit]
Description="HashiCorp Consul - A service mesh solution"
Documentation=https://www.consul.io/
Requires=network-online.target
After=network-online.target
ConditionFileNotEmpty=/etc/consul.d/consul.hcl

[Service]
EnvironmentFile=-/etc/consul.d/consul.env
User=consul
Group=consul
ExecStart=/usr/bin/consul agent -config-dir=/etc/consul.d/
ExecReload=/bin/kill --signal HUP $MAINPID
KillMode=process
KillSignal=SIGTERM
Restart=on-failure
LimitNOFILE=65536

[Install]
WantedBy=multi-user.target
and now enabling, adding user permissions and starting the service
# Change consul directories permissions
chown -R consul:consul /opt/consul
chown -R consul:consul /etc/consul.d

# Enable consul service
systemctl enable consul.service
service consul start
service consul status
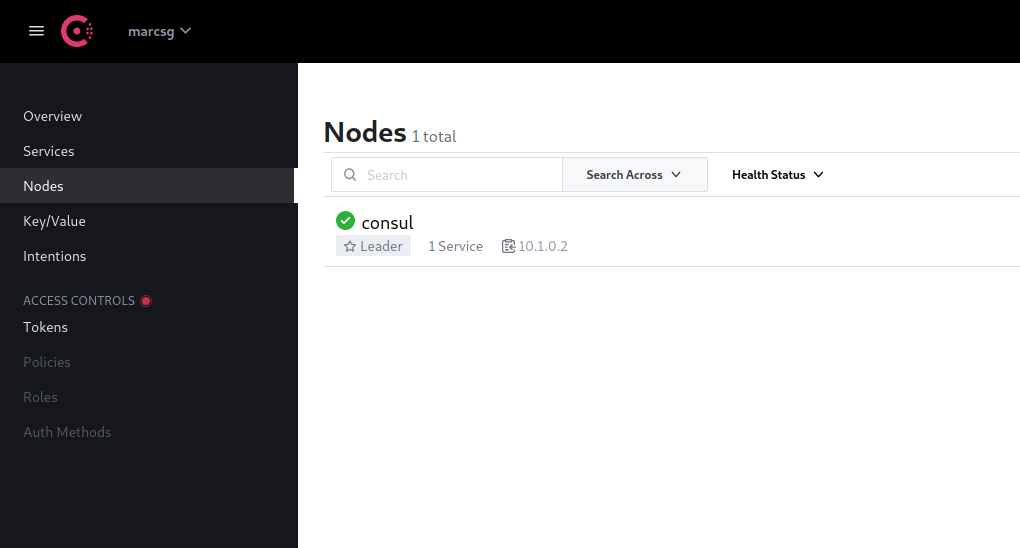
Now, if we go to http://10.1.0.2:8500 we can access to consul's web ui and see our up/down services, currently it's only the consul server itself
It's important to monitor our services, so we are using node_exporter to monitor our server, to install it we need to run the following script:
cd /tmp/
wget https://github.com/prometheus/node_exporter/releases/download/v1.3.1/node_exporter-1.3.1.linux-amd64.tar.gz
tar -xvzf node_exporter-1.3.1.linux-amd64.tar.gz
cp node_exporter-1.3.1.linux-amd64/node_exporter /usr/bin/node_exporter
And we are going to create it's service file /etc/systemd/system/node_exporter.service, enable it and start the service
[Unit]
Description=Node Exporter
Wants=network-online.target
After=network-online.target

[Service]
Type=simple
ExecStart=/usr/bin/node_exporter --collector.systemd --collector.processes

[Install]
WantedBy=multi-user.target
And run
systemctl enable node_exporter.service
service node_exporter start
if we go to http://10.1.0.2:9100/metrics, we're going to see a bunch of text, it'll be read from prometheus
Nginx servers
Our nginx servers will need 3 services:
- node_exporter
- consul agent
- nginx server
A simple nginx server installation will fit for our setup:
apt-get update && apt-get install nginx -y
if we go to http://10.1.1.x (x = server's ip) we must be able to see a default nginx website
As we did with our consul server, we're installing node_exporter to our nginx servers, this is what will be auto-discovered later when auto scaling
cd /tmp/
wget https://github.com/prometheus/node_exporter/releases/download/v1.3.1/node_exporter-1.3.1.linux-amd64.tar.gz
tar -xvzf node_exporter-1.3.1.linux-amd64.tar.gz
cp node_exporter-1.3.1.linux-amd64/node_exporter /usr/bin/node_exporter
And we are going to create it's service file /etc/systemd/system/node_exporter.service, enable it and start the service
[Unit]
Description=Node Exporter
Wants=network-online.target
After=network-online.target

[Service]
Type=simple
ExecStart=/usr/bin/node_exporter --collector.systemd --collector.processes

[Install]
WantedBy=multi-user.target
And run
systemctl enable node_exporter.service
service node_exporter start
To check it's installation, we can go to http://10.1.1.x:9100/metrics
For consul auto-discovery, we surely need a consul client running in our nginx servers
# Update and install gnupg2 and curl for the following commands
apt-get update && apt-get install gnupg2 curl lsb-release

# Add consul's gpg key
curl -fsSL https://apt.releases.hashicorp.com/gpg | apt-key add -

# Add hashicorp's repository to our sources.list
echo "deb [arch=amd64] https://apt.releases.hashicorp.com $(lsb_release -cs) main" > /etc/apt/sources.list.d/hashicorp.list

# Update and install consul
apt-get update && apt-get install consul

# Check Consul installation version
consul -v
Once installed, we need to configure it, our consul client installation will use 2 config files, consul.json and services.json as it needs to tell consul which services are running in the server
{
 "datacenter": "marcsg",
 "data_dir": "/var/consul",
 "encrypt": "3EY9MGe2a1ElUNrsl5E6rHAtJEL7lqe+1CDZAyY8yTU=",
 "log_level": "INFO",
 "enable_syslog": true,
 "enable_debug": true,
 "enable_script_checks": true,
 "server": false,
 "leave_on_terminate": true,
 "rejoin_after_leave": true,
 "retry_join": [
    "10.1.0.2"
    ]
}
{
  "services": [
    {
      "name": "node_exporter",
      "tags": [
        "node_exporter"
      ],
      "port": 9100,
      "checks": [
        {
          "tcp": "localhost:9100",
          "interval": "10s"
        }
      ]
    },
    {
      "name": "nginx",
      "tags": [
        "nginx"
      ],
      "port": 80,
      "checks": [
        {
          "tcp": "localhost:80",
          "interval": "10s"
        }
      ]
    }
  ]
}
With this configuration, we are checking each 10 seconds if node_exporter and nginx are up. We aren't using the nginx section as it's for a future expansion of this post, but we are using the node_exporter one as we are going to use Prometheus & Grafana to talk to consul server and have an automatically updated list of our nginx servers. But we can add a Prometheus exporter to the services.json and use it on Prometheus & Grafana
We only need to create consul as a service, we're going to edit it's systemd service to delete some files when stopping the service
/etc/systemd/system/consul.service
[Unit]
Description="HashiCorp Consul - A service mesh solution"
Documentation=https://www.consul.io/
Requires=network-online.target
After=network-online.target
ConditionFileNotEmpty=/etc/consul.d/consul.hcl

[Service]
EnvironmentFile=-/etc/consul.d/consul.env
ExecStartPre=/bin/sh -c "systemctl set-environment HOST_IP=$(hostname -I | awk {'print $1'})"
ExecStart=/usr/bin/consul agent -config-dir=/etc/consul.d/client -bind=${HOST_IP}
ExecStop=/usr/bin/rm /var/consul/node-id
ExecReload=/bin/kill --signal HUP $MAINPID
KillMode=process
KillSignal=SIGTERM
Restart=on-failure
LimitNOFILE=65536

[Install]
WantedBy=multi-user.target
systemctl enable consul.service
systemctl start consul-service
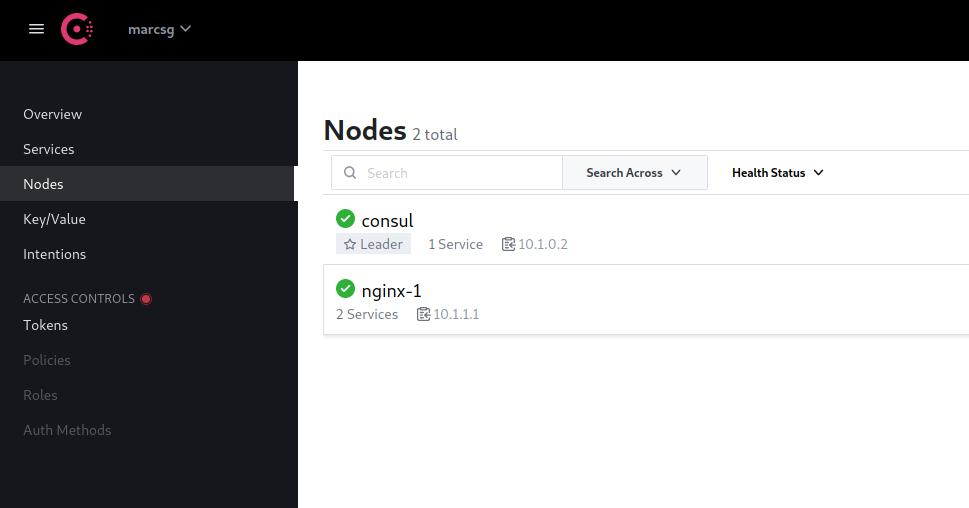
And if we go to our consul server ui nodes section http://10.1.0.2:8500 we'll find our nginx server has been registered
 Note: It's important to say that if we want to create this servers as an image/template, we must delete
 /var/consul/node-id before stopping the instance for cloning as it contains the server's id and consul will only detect only one and overwrite the rest of servers.
Prometheus and Grafana
Download latest Prometheus binary at https://prometheus.io/download/
# Prometheus Installation
cd /tmp/
wget https://github.com/prometheus/prometheus/releases/download/v2.37.0/prometheus-2.37.0.linux-amd64.tar.gz
tar -xvzf prometheus-2.37.0.linux-amd64.tar.gz
cp /tmp/prometheus-2.37.0.linux-amd64/prometheus /usr/bin/prometheus
useradd --system prometheus
mkdir /etc/prometheus /var/lib/prometheus
cp /tmp/prometheus-2.37.0.linux-amd64/prometheus.yml /etc/prometheus/prometheus.yml
cp -r /tmp/prometheus-2.37.0.linux-amd64/consoles /etc/prometheus/consoles
cp -r /tmp/prometheus-2.37.0.linux-amd64/console_libraries /etc/prometheus/console_libraries
chown -R prometheus:prometheus /etc/prometheus
chown -R prometheus:prometheus /var/lib/prometheus

# Grafana Installation
sudo apt-get install -y adduser libfontconfig1
wget https://dl.grafana.com/enterprise/release/grafana-enterprise_9.0.4_amd64.deb
sudo dpkg -i grafana-enterprise_9.0.4_amd64.deb
Now we must create prometheus service and enable it:
/etc/systemd/system/prometheus.service
[Unit]

Description=Prometheus
Wants=network-online.target
After=network-online.target

[Service]

User=prometheus
Group=prometheus
Type=simple
ExecStart=/usr/bin/prometheus --config.file /etc/prometheus/prometheus.yml \
--storage.tsdb.path /var/lib/prometheus/ --web.console.templates=/etc/prometheus/consoles \
--web.console.libraries=/etc/prometheus/console_libraries

[Install]

WantedBy=multi-user.target
SyslogIdentifier=prometheus
Restart=always
And enable prometheus service
systemctl enable prometheus.service
service prometheus restart
service grafana-server restart
Now we do have prometheus and grafana working
- grafana's port: 3000
- Prometheus port: 9090
Prometheus does not have authentication, but grafana does, it's default credentials are:
username: adminpassword: admin

Now we only need to configure prometheus.yml to listen to consul and creating node_exporter's grafana dashboard
/etc/prometheus/prometheus.yml
global:
  scrape_interval: 15s
  evaluation_interval: 15s
scrape_configs:
  - job_name: "prometheus"
    static_configs:
      - targets: ["localhost:9090"]

# node exporter configuration,
  - job_name: "node_exporter"
    consul_sd_configs:
      - server: "10.1.0.2:8500"
        datacenter: "marcsg"
        services: [node_exporter]
    relabel_configs:
      - source_labels: [__address__]
        target_label: instance
service prometheus restart
Let's set-up grafana to use prometheus as a data source here http://192.168.43.39:3000/datasources/new and choose Prometheus
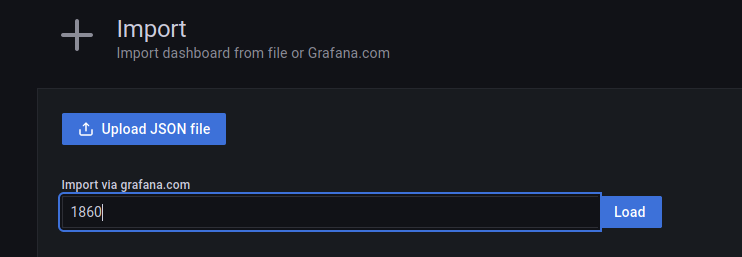
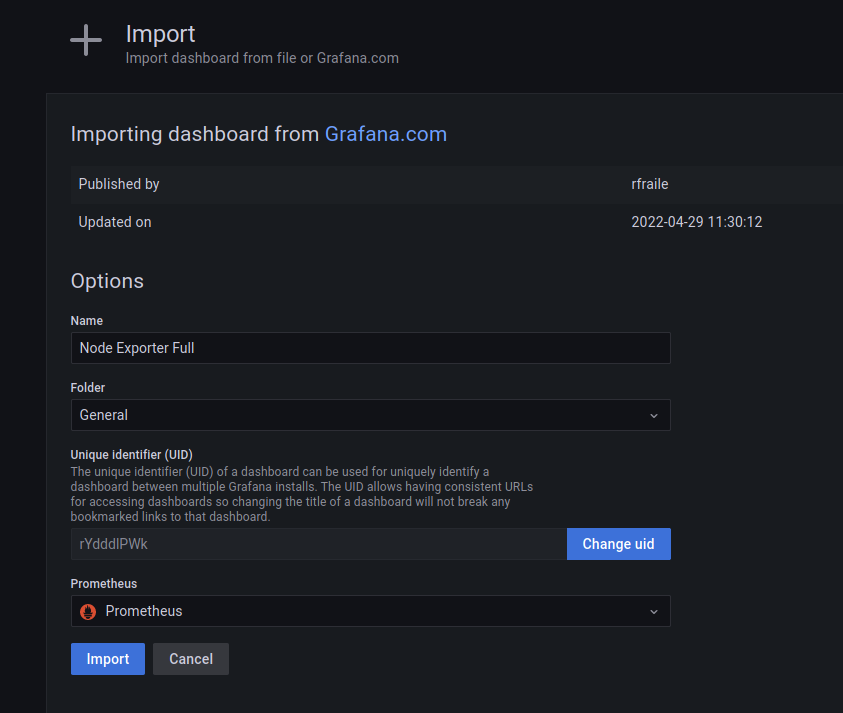
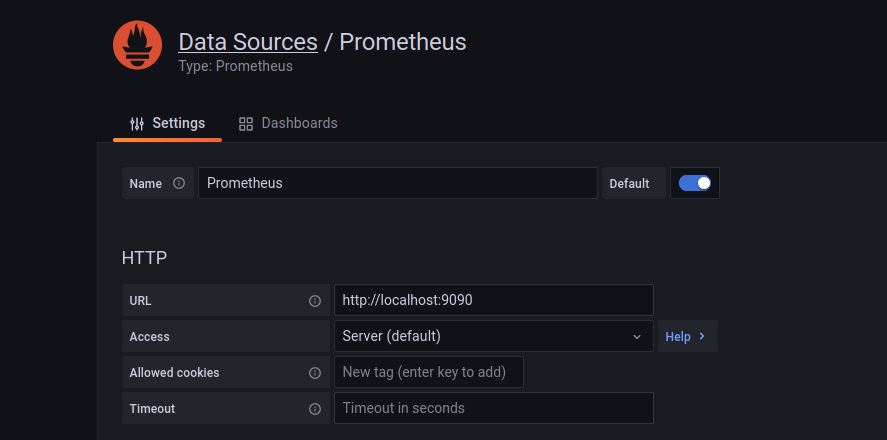 Fill the url with 127.0.0.1:9090 as it's suggested and Save. It's time to import node_exporter dashboard here http://192.168.43.39:3000/dashboard/import , use the 1860 id and select Prometheus data source
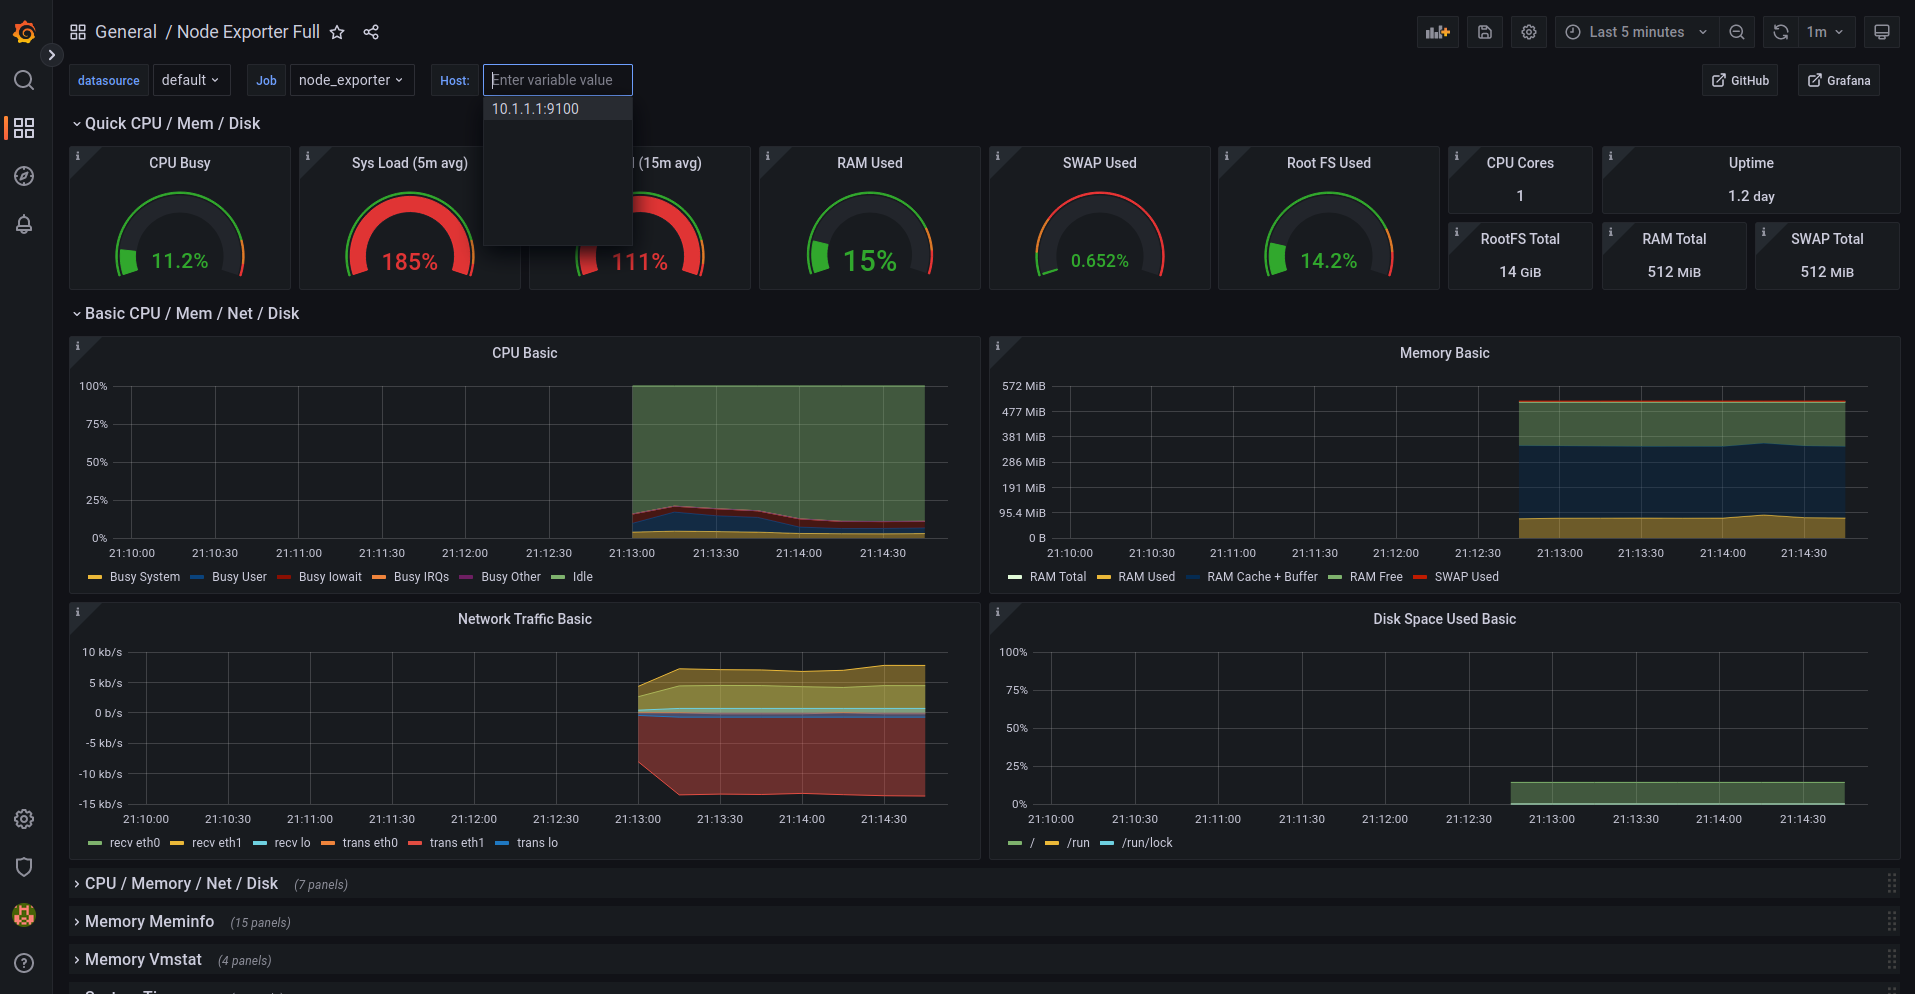
 Now we can select all the online hosts self-discovered in our consul server
On the Host: dropdown, we'll be able to see all our nginx-servers
Now we can select all the online hosts self-discovered in our consul server
On the Host: dropdown, we'll be able to see all our nginx-servers
 This is applicable for every prometheus exporter, we're using node_exporter, but we can use any exporter, set it up on
 /etc/prometheus/prometheus.yml on prometheus+grafana server and on /etc/consul.d/client/services.json file (in this case, nginx-servers)